Latest Article|September 3, 2020|Free
::Making Grown Men Cry Since 1992
2 min read
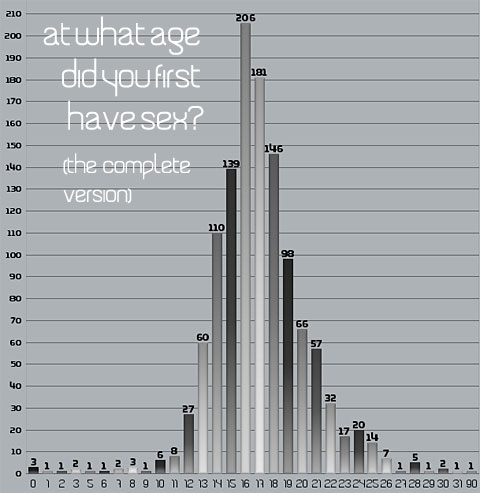
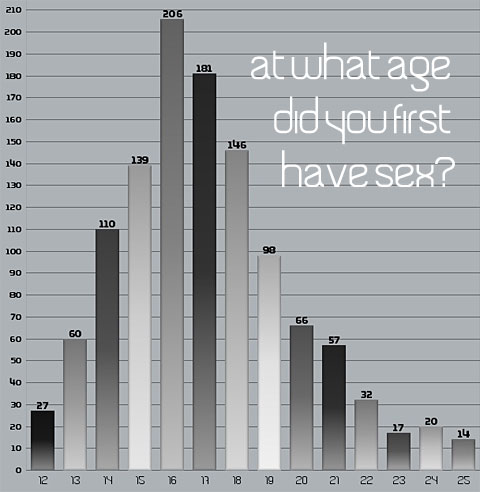
Well, I coulda called it. In fact, I did call it: The hate mail has already started to pour in from pissed-off statisticians who found the (ahem) science of the Alibi’s First Ever Sex Survey to be somewhat slipshod. One guy even took issue with the “missing interval” in our when-did-you-lose-your-virginity graph and called our histogram “poorly constructed.” Them’s fightin’ words, partner! And if we knew what a histogram was, we’d be goddamn well pissed off about it. But let’s just get this out there right in the open right now: those finding the science to be lacking simply failed to notice that there was no science AT ALL. Dammit, Jim, I’m a newspaper man, not a statistician.Here’s the truth: We used the WRONG NUMBERS for the virginity/age graph. They were actually the numbers from the “how old are you” demographic question, hence the failure of the graph to “correlate with the discussion.” So in the end, it’s not a question of missing intervals and histowhatsits, it is instead a question of being a fuckup. In the interest of both science and setting the record straight, here now is the RIGHT GRAPH—both a legible one with low-scoring answers omitted (a practice applied to pretty much all the graphs we ran) and an ALMOST ILLEGIBLE one with ALL THE DATA (including such spurious answers as “0” and “1”). Happy? I hope so. More sexy graphs to come. Stay tuned.